As a GIS developer, you’re always on the lookout for new tools to make your job easier. GitHub is a great resource for discovering libraries that can save you time and effort in developing GIS applications. In this article, we’ll introduce you to ten must-use GitHub libraries for GIS developers.
10. PySAL
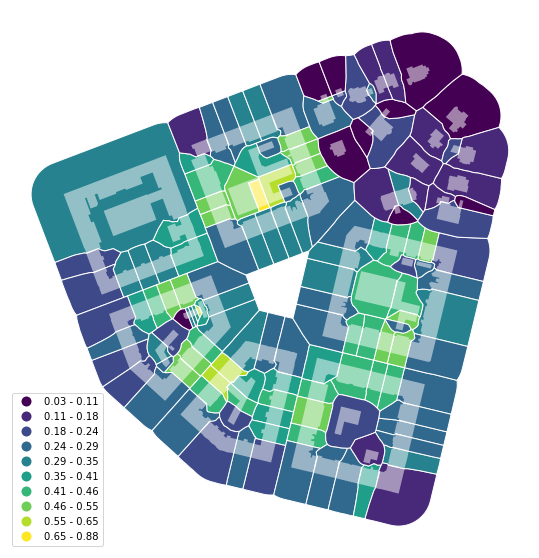
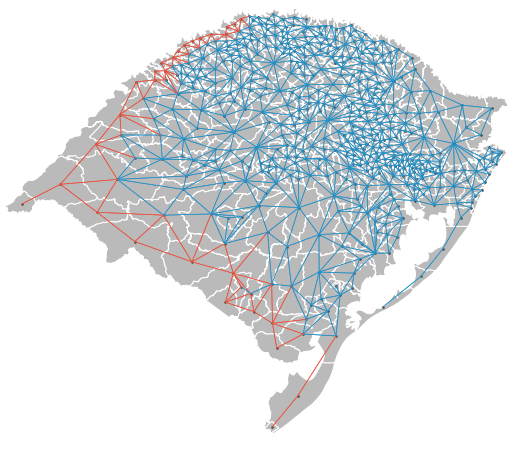
PySAL is a Python library for spatial analysis. It provides a wide range of functions for calculating spatial statistics, clustering, and modelling. PySAL is easy to use and can be integrated with other Python libraries, such as Shapely and Fiona.


import pysal.lib.weights as weights
import pysal.explore.esda as esda
w = weights.Queen.from_shapefile('input.shp')
y = [1, 2, 3, 4, 5]
mi = esda.moran.Moran(y, w)
print(mi.I)
9. Fiona
Fiona is a Python library for reading and writing geospatial data in different formats. It supports a wide range of formats, including Shapefile, GeoJSON, and KML. Fiona is easy to use and can be integrated with other Python libraries, such as Shapely and PySAL.
import fiona
with fiona.open('input.shp') as src:
    for feature in src:
        print(feature)
8. Shapely
Shapely is a Python library for performing geometric operations on spatial data. It provides a wide range of functions for creating and manipulating geometries, including points, lines, and polygons. Shapely is easy to use and can be integrated with other Python libraries, such as Fiona and PySAL.
from shapely.geometry import Point
point = Point(45.5231, -122.6765)
buffer = point.buffer(0.1)
print(buffer)
7. GeospatialPDF
GeospatialPDF is a Python library for creating geospatial PDF documents. It supports a wide range of map providers, including Google Maps, OpenStreetMap, and Bing Maps. GeospatialPDF is easy to use and can be integrated with other Python libraries, such as PyPDF2 and ReportLab.
from geospatialpdf import GeospatialPDF

pdf = GeospatialPDF('output.pdf')
pdf.add_map('https://tile.openstreetmap.org/{z}/{x}/{y}.png', (45.5231, -122.6765), 13)
pdf.save()
6. Proj4js
Proj4js is a JavaScript library for converting coordinates between different projections. It supports a wide range of coordinate systems, including WGS84, UTM, and State Plane. Proj4js is easy to use and can be integrated with other JavaScript libraries, such as Leaflet and OpenLayers.
proj4.defs("EPSG:26910","+proj=utm +zone=10 +datum=NAD83 +units=m +no_defs");
var from = proj4('EPSG:4326');
var to = proj4('EPSG:26910');
var point = [45.5231, -122.6765];
var utmPoint = proj4(from, to, point);
console.log(utmPoint);
5. D3,js
D3.js is a JavaScript library for data visualization. It provides a wide range of functions for creating charts, graphs, and maps. D3.js is flexible and customizable, and can be used to create interactive and dynamic visualizations.
d3.json('https://d3js.org/us-10m.v1.json', function(error, us) {
    var path = d3.geoPath();
    var svg = d
4. OpenLayers
OpenLayers is a JavaScript library for creating interactive maps and geospatial applications. It supports a wide range of map providers, including Google Maps, Bing Maps, and OpenStreetMap. OpenLayers is easy to use and has a large community of contributors.
var layer = new ol.layer.Tile({
    source: new ol.source.TileWMS({
        url: 'https://demo.boundlessgeo.com/geoserver/wms',
        params: {
            'LAYERS': 'ne:NE1_HR_LC_SR_W_DR',
            'TILED': true
        }
    })
});
map.addLayer(layer);
3. Mapbox GL JS
Mapbox GL JS is a powerful JavaScript library for creating customizable and interactive vector maps. It offers a wide range of styling options, including color gradients, pattern fills, and 3D extrusions. Mapbox GL JS is easy to integrate with other JavaScript frameworks, such as React and Vue.
var marker = document.createElement('div');
marker.className = 'marker';
new mapboxgl.Marker(marker)
    .setLngLat([-77.0365, 38.8977])
    .addTo(map);
2 .Turf.js
Turf.js is a JavaScript library for advanced geospatial analysis. It provides a wide range of functions for calculating distances, buffering geometries, and performing spatial joins. Turf.js is easy to use, well-documented, and has no external dependencies.
var point = turf.point([-77.031669, 38.878605]);
var line = turf.lineString([[-77.031669, 38.878605], [-77.029609, 38.881946], [-77.020339, 38.884084]]);
var nearestPoint = turf.nearestPointOnLine(line, point);
console.log(nearestPoint);
1. Leaflet
Leaflet is an open-source JavaScript library for mobile-friendly interactive maps. It’s lightweight, easy to use, and supports a wide range of map providers. With Leaflet, you can add markers, polygons, and other layers to your maps, and customize their appearance using CSS.
var map = L.map('mapid').setView([51.505, -0.09], 13);
L.tileLayer('https://{s}.tile.openstreetmap.org/{z}/{x}/{y}.png', {
attribution: 'Map data © <a href="https://www.openstreetmap.org/">OpenStreetMap</a> contributors',
maxZoom: 18
}).addTo(map);Summary of GitHub libraries for GIS Developers
In conclusion, these ten GitHub libraries for GIS Developers are often essential in their work. They offer a wide range of functionalities and can save you time and effort in developing GIS applications. So, be sure to check them out and see how they can improve your work!
By the way, maybe you’re looking for JavaScript code for adding the GeoJSON button? Check it out!

